


Updates
DecemberNovemberOctoberSeptemberAugustJulyJuneMayAprilMarchFebruaryJanuary
Random Update
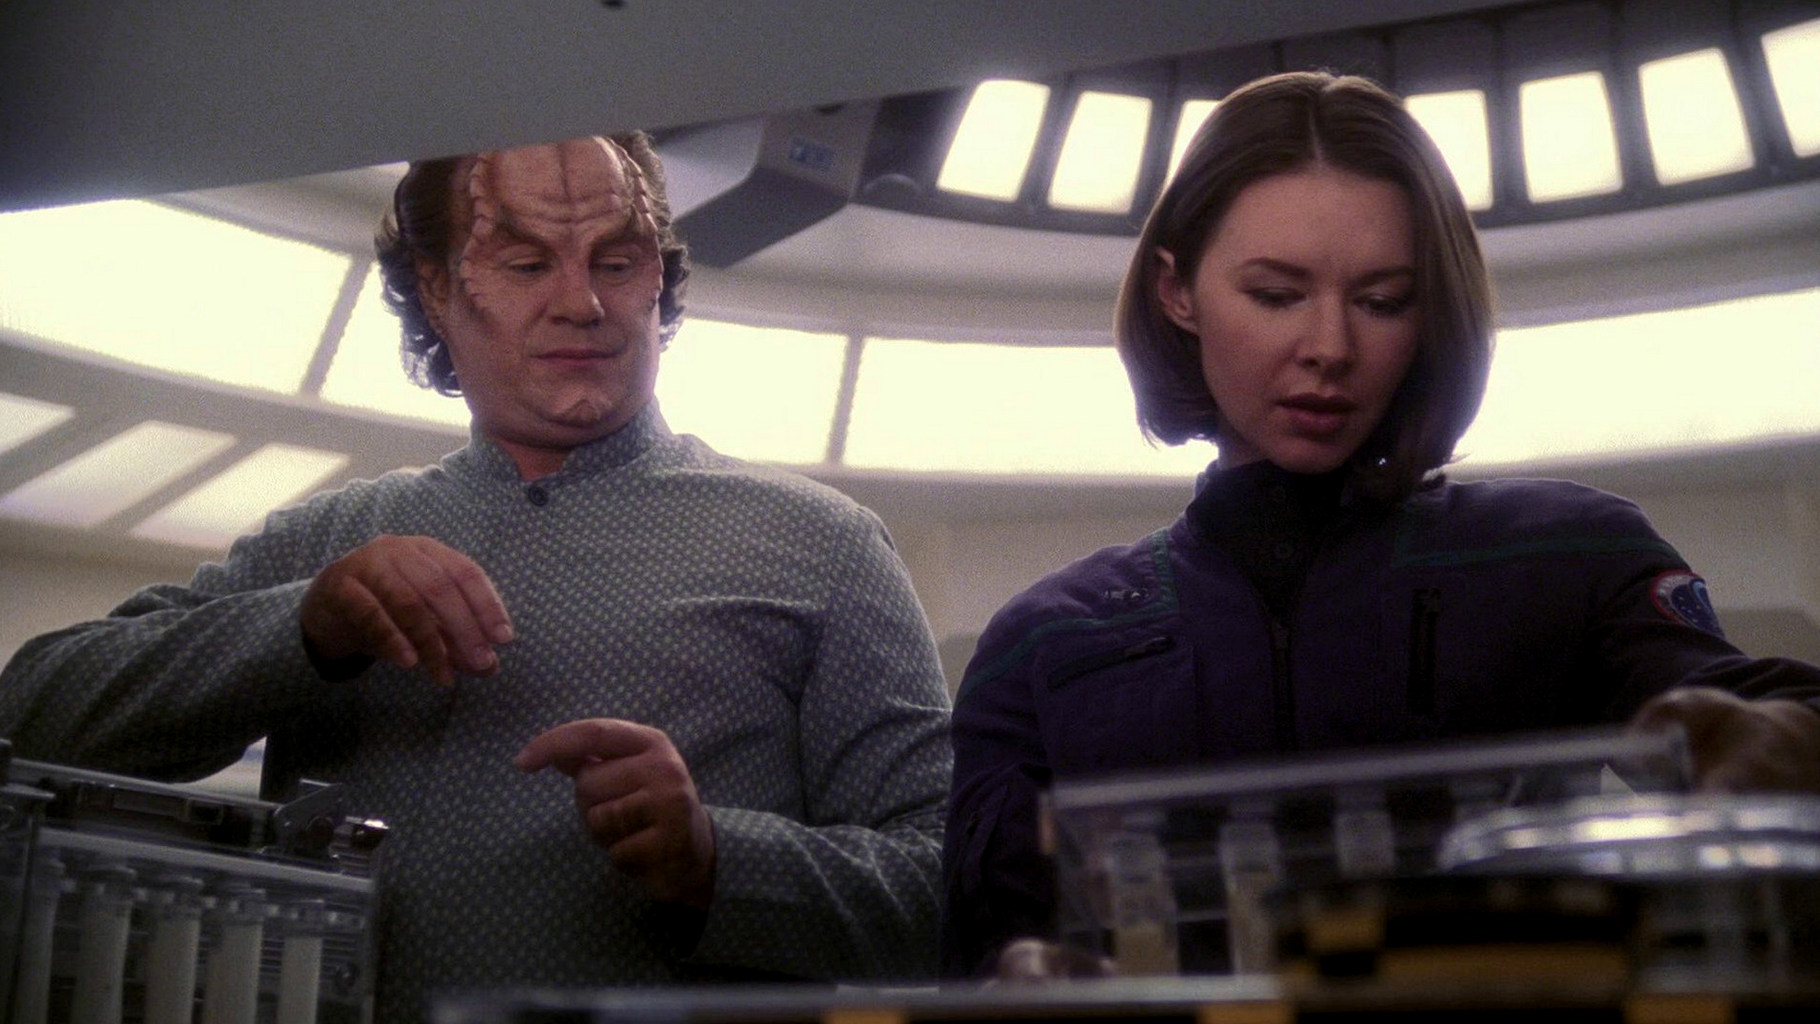
 Star Trek Enterprise (ENT) Season 1 ...
deardoctor.jpg, 1820x1024 pixels
Pages with Recent Changes
- Commercially Available Lighting in Star Trek
04 Jul 2026 - Commercially Available Chairs in Star Trek
04 Jul 2026 - Star Trek Enterprise (ENT) Season 1 Reviews
04 Jul 2026 - Substances and Particles A-E
03 Jul 2026 - Vulcan Ship Classes
03 Jul 2026 - Alpha and Beta Quadrant Ships of Unknown A...
03 Jul 2026 - Fleet Chart Annotations
03 Jul 2026 - Starship Gallery - Other Aliens of the 22n...
03 Jul 2026 - Visual Bloopers
02 Jul 2026 - Observations in TNG: "The Enemy"
30 Jun 2026 - Observations in TNG: "The Price"
28 Jun 2026 - Re-Used Props - Badges & Jewelry
28 Jun 2026 - Re-Used Costumes
28 Jun 2026 - The Evolution of the Romulans
28 Jun 2026 - Variations of the TOS Desktop Monitor
27 Jun 2026 - Variations of the DS9 Desktop Monitor
27 Jun 2026 - Variations of the TNG Desktop Monitor
27 Jun 2026 - Variations of the VOY Desktop Monitor
27 Jun 2026 - Substances and Particles L-R
25 Jun 2026 - Logikprobleme bei Star Trek: Voyager
24 Jun 2026
July
Here are two more Enterprise season 1 retro reviews: "Cold Front" and "Silent Enemy".
June
I have added new references and better pictures to two more old articles by Jörg: Observations in TNG: "The Enemy" and Observations in TNG: "The Price".
I've posted two more Enterprise retro reviews: "Civilization" and "Fortunate Son". One is an often overlooked episode that perhaps plays it a little too nice. The other is a deserved classic that almost everyone seems to like. Read my reviews to find out whether my opinion of either episode has changed over the past 25 years.
Two more Enterprise retro reviews are online. Going into this rewatch, "The Andorian Incident" was one of the candidates I firmly expected to reassess. Read the review to find out. I also look at the quieter "Breaking the Ice", an episode about comets, human-Vulcan relations and the first cracks in the ice between T'Pol and Trip.
With my Voyager review project now complete, here is an editorial reflecting on the series and its enduring reputation. I also look ahead to the next part of the review tour, which has just started: Star Trek Enterprise.
Two more Enterprise season 1 retro reviews: "Unexpected" and "Terra Nova".
The official Strange New Worlds season 4 trailer has arrived. After the dismal third season, the bar is admittedly very low, so I definitely expect an improvement. Whether season 4 will keep the promise of being "more serious" is another question. Read my comment.
It probably isn't a surprise that the best starship designs in my view are all from classic series and movies. It may be interesting to look at my favorites from recent Trek though. Here are my 10 Favorite Starships of Modern Trek, including designs perhaps no one would have reckoned with.
Here are the next two updated Enterprise reviews: "Fight or Flight" and "Strange New World".
After completing the updates of my Voyager reviews, I am now revisiting Enterprise. All of these reviews were written when the episodes first aired, and over the past 25 years my views on many of them may have changed. So let us start with the pilot episode, "Broken Bow".
Some Star Trek TV series fill the entire screen, some are letterboxed, and the classic ones need pillarboxing. A new article investigates The Evolution of Screen Ratios in Star Trek, summarizes the formats, points out oddities and discusses the technical and artistic reasons.
May
For decades, Star Trek productions have relied on physical matte paintings, many of which have become iconic. A new article shows Notable Matte Paintings in Classic Star Trek and how they were used and re-used on screen. It places special focus on the contributions of Albert Whitlock, Syd Dutton and Robert Stromberg, artists whose original pieces appeared in Heritage Auctions between 2019 and 2021. Tell me in the comments which is your favorite!
Less than two months to go. Everything is ready at EAS for recaps and reviews of Strange New Worlds season 4, which will begin with "Valles Marineris" on July 23.
I originally just wanted to to untangle the investigations related to uniforms and inisgnias. But I went the whole way and created three practically new articles. The Changing Styles of Starfleet Uniforms keeps track of the many changes and the resulting problems. Starfleet Uniform & Rank Issues looks at mismatched insignias, odd uniform choices and bloopers like missing rank pips. The Starfleet Delta Symbol (this is the most extensive one in many years!) is about the evolution of the insignia and whether it used to represent only the Enterprise or the whole fleet. Bear with me, the last article is far from complete.
I've added a lightweight image modal to all static EAS pages. You can now browse images in a clean overlay and navigate with mouse clicks, keyboard arrows or swipe gestures. And if you like things the old-fashioned way, CTRL-click still opens the plain URL in a new tab. It's intentional that the modal loads with a short delay, so it doesn't work when you click immediately after the page appears. As always - please don't hesitate to report problems to me.
I conclude my Voyager reviews with the playful but somewhat shallow "Renaissance Man" and the ambitious series finale "Endgame", which works better for me today than it did 25 years ago.
Two more old articles upgraded: Observations in TNG: "The Bonding" and Observations in TNG: "Booby Trap".
I have added more references and better pictures to Jörg's article with Observations in TNG: "In Theory".
Approaching the series finale. Here are the retro reviews of VOY: "Natural Law" and "Homestead" - one a fairly routine episode but with an interesting Prime Directive variation, the other a fitting and emotional farewell to Neelix despite some doubts.
April
Two more old articles have been updated with new references and better pictures: Observations in TNG: "The Survivors" and Observations in TNG: "Who Watches the Watchers".
Strange New Worlds returns with season 4 on July 23, and a new teaser trailer has been released. I have added a brief comment.
New Voyager retro reviews are up: "Author, Author" and "Friendship One". The Doctor comes off as vain and insensitive, and the story still reframes him as the victim, while the second episode wastes a strong premise on a routine hostage plot and avoids its own key questions.
I'm pleased to announce that TNG-Picard.com is a recipient of the EAE Award: a remarkable archive that shows a vast collection of screen-used costumes, props and models from TNG and Picard, built on a lifelong passion.
Two more Voyager retro reviews: "Human Error" and "Q2". Recycled ideas and unrewarding outcomes hold both episodes back, from Seven's stalled development to Q Junior's predictable character test.
Here are two more updated old articles: Observations in TNG: "The Ensigns of Command" and Observations in TNG: "Evolution".
Jörg's article on Observations in TNG: "The Mind's Eye" has been updated with new references and more and better screen caps.
Here is the last new story by Travis Anderson for now: Invasion.
Here are two more reviews from Voyager season 7: "The Void" and "Workforce I/II". These episodes offer interesting variations on familiar themes and still rank comparably high in my view.
The fifth of six new SID Rebirth stories by Travis Anderson: Criminal Underworld.
Two more old articles updated with new references, better screen caps and other improvements: Observations in TNG: "Peak Performance" and Observations in TNG: "Shades of Gray".
The next SID Rebirth story by Travis Anderson: Religious Strife.
Voyager retro reviews of two episodes that couldn't be more different: the thought-provoking morality tale "Repentance" and the hollow myth farce "Prophecy".
Here is another SID Rebirth story by Travis Anderson: The Orb.
I have updated the Links as well, though I had to remove more than I could add.
Continuing with my Voyager retro reviews. Here are "Shattered" and "Lineage". I have revised my views on both episodes, and in opposite directions.
Here is the next SID Rebirth story by Travis Anderson: Civil Unrest.
March
Three items can always be found on Picard's ready room desk on the Enterprise-D: a black desktop monitor, a rack of orange isolinear circuits and finally a crystal. Jörg found out much more about the latter than we would have expected. See his all-new article Picard's Ready Room Crystal.
Continuing with the SID Rebirth series by Travis Anderson. Here is the next story: Syndicate.
Starfleet Academy has been canceled after only two seasons. Read Alex Kurtzman and Noga Landau's message and my comment on this latest situation.
There are several additions and improvements in Jörg's article on Observations in TNG: "The Host".
And here are the new Discoverse Future Alien Ship Classes: Torothan, Venari Ral and, of course, Klingon.
I have added the designs from Starfleet Academy season 1 to the Discoverse Future Federation Ship Classes. I don't expect it to be quite complete, so please let me know what I missed!
My review of the Starfleet Academy season finale "Rubincon" is up now. One interesting aspect is what doesn't happen. Beyond that, the path to the resolution feels predictable and plot-driven, though there are enjoyable character moments.
Here is a gallery of Starfleet Academy Characters.
Starfleet Academy delivers its so far clearly best episode with "300th Night". The season finale is only one week away, and I think there's hope for the series again.
Two more old articles updated with new references, new screen caps and other improvements: Observations in TNG: "Manhunt" and Observations in TNG: "The Emissary".
February
Still no positive development: Today's Starfleet Academy episode "The Life of the Stars" sinks into endless emotional talk and turns into the most tedious hour this series has delivered.
Several additions and improvements in Jörg's article on Observations in TNG: "Half a Life".
The latest Starfleet Academy review is up: "Ko'Zeine" tries to build emotional stories about course corrections in the lives of two cadets, but ends up feeling shallow and predictable.
The latest Starfleet Academy episode "Come, Let's Away" comes with a serious situation and a dramatic tonal shift. I welcome the change, but the story is not as convincing and suspenseful as it could have been.
I needed a break from SFA and so I reviewed three more Voyager season 7 episodes, VOY: "Nightingale" and the double feature VOY: "Flesh and Blood I/II".
Here is my review of SFA: "Series Acclimation Mil". It features two great cameos, but also a contrived reveal and plenty of misplaced humor. The result is that SAM learns more about herself than about the subject she set out to study.
January
Today's Starfleet Academy episode "Vox in Excelso" explores the art of debate, the traumatic experiences of a cadet and the fate of his species, but it doesn't handle any of it as well as it could have.
Here is my review of this week's Starfleet Academy episode "Vitus Reflux". It fails on so many levels from the silly fungus with a stupid name to the questionable moral that I don't know where to start. I expect that this will remain a one-time misfire, though.
As I can tell from the fan reactions, Starfleet Academy may be the most divisive Trek series ever. But that doesn't have to be so. I have compiled a few thoughts on the new series that are not yet covered in my reviews: Why Starfleet Academy Deserves a Chance.
Here are the promised article updates with facts from the first two Starfleet Academy episodes: Classical Music in Star Trek, Locating Starfleet Buildings in San Francisco, The Emblem of Starfleet Academy, The Evolution of the Federation Emblem. Check out the "Pages with Recent Changes" list for even more updates.
Here is my (less positive) review of the second episode, SFA: "Beta Test". I have added references from the pilot to various sections of the site. "Beta Test" will follow in next couple of days, including the details on the classical music (Mozart's Die Zauberflöte and Beethoven's Fidelio).
Starfleet Academy is burdened by an unpopular series idea and is additionally set in Discovery's unloved post-Burn era. Read my full review of the premiere "Kids These Days" for a first assessment of whether this series can find its place in the Star Trek Universe.
More Voyager season 7 retro reviews. Here are "Inside Man" and "Body and Soul".
On episode index pages such as DS9, the diagrams are now generated automatically from the reviews on the site. This removes the need for manual Excel exports and ensures the data is always consistent.
It's Voyager retro review time again. Here are "Repression" and "Critical Care".
Happy New Year 2026! There is no new content yet, but maybe this is a good time to check out the highlights on EAS from 2025. Major new articles look at Design Issues of the Original Enterprise and Voyager's Maquis Crew. Besides innumerable small additions, there are also all-new articles by Jörg, such as Paintings and Photos in Picard's Study or Suliban Emblems and Writing.
Almost needless to mention, the Starship Database is up to date with the designs from the latest episodes. Also have a look at the Journal of Applied Treknology that I redesigned from the ground up. Last but not least, there is the configurable and sortable episode master list, complete with the option to show the data in the form of a bar chart or histogram.


